Membership Analytics
Summary:
In this section, you will be able to view the progress of each of your courses and assessments
Creating a course is no small task since you're offering your clients a learning opportunity, keeping track of their progress helps you engage your clients better. This way you can ensure they complete the provided material and leave with a positive experience, priming them for upsells. Another aspect to consider is the ROI these courses are offering you, the Membership Analytics section allows you to access this information.
Product Analytics
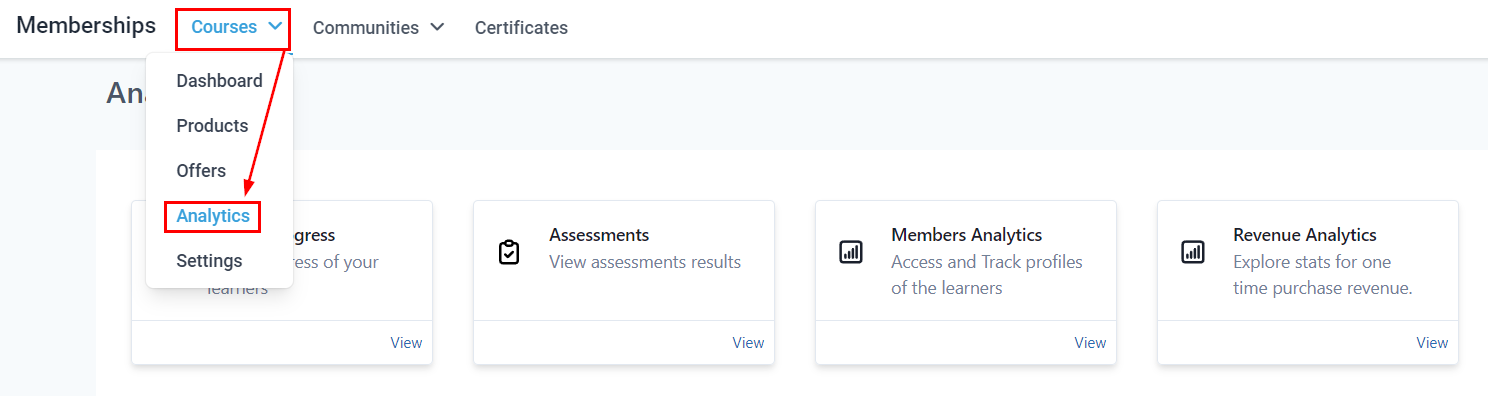
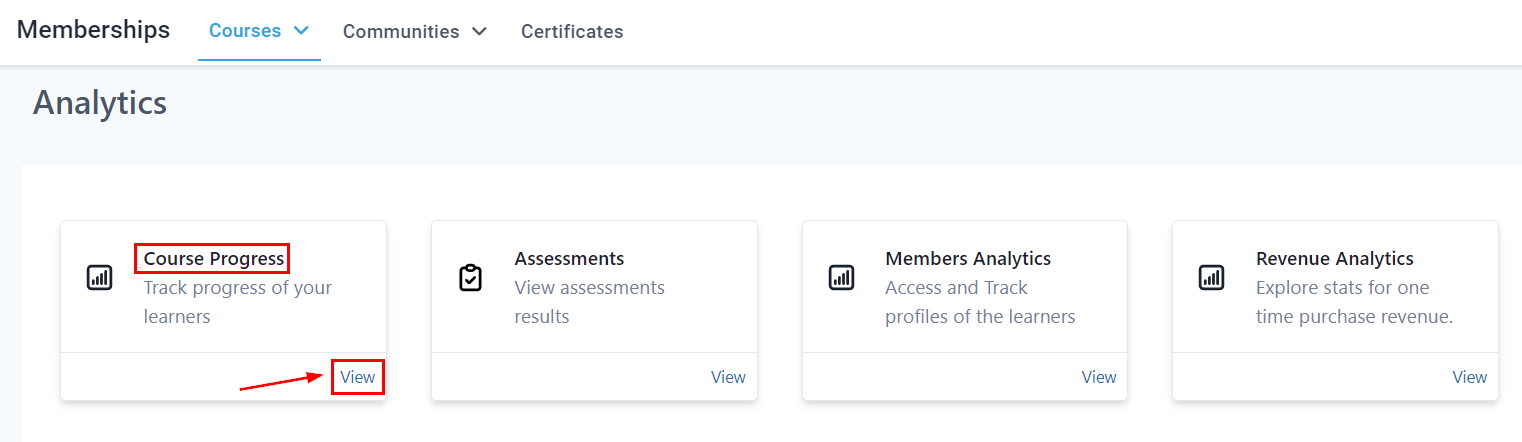
In this section, you will be able to view the progress of each of your courses and assessments. You can see their progress level (in percentage), their first login date and time, the last time they visited the product, and the number of times they logged in.
Product Progress
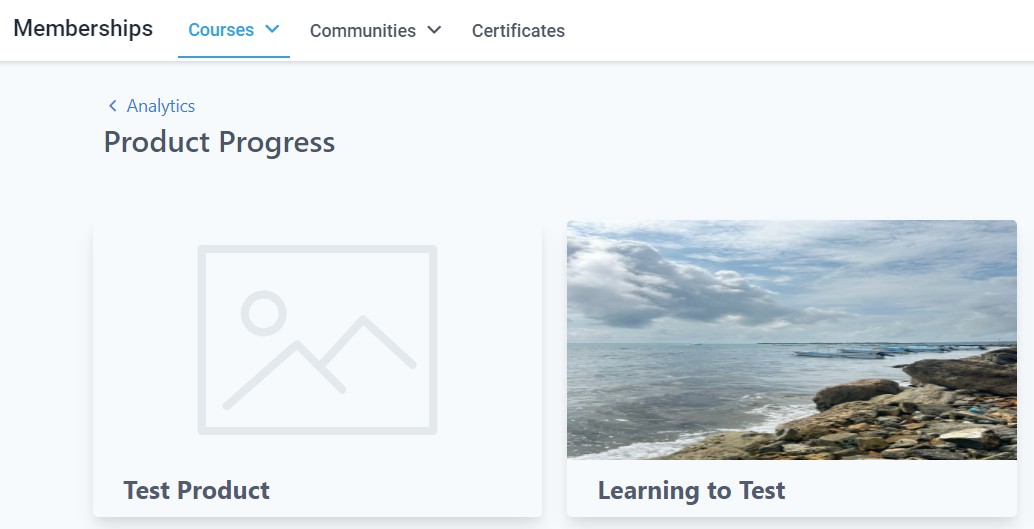
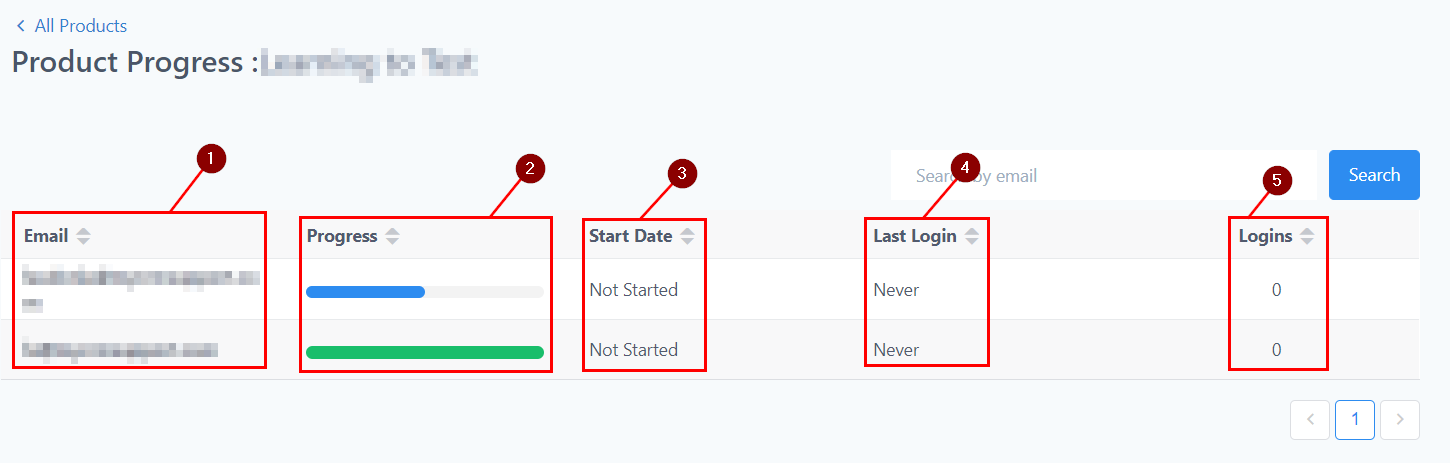
Once you've selected the course progress, you will be directed to this page where you can select the product you want to view.
- Email: Here, you will see the email of the visitors who logged in to the product.
- Progress: In this column, you will see the progress of the product using a percentage; 100% means the visitor viewed the whole module of the product, any percentage lesser than 100% means the visitor hasn't completed the module and a visitor without any percent bar means they haven't opened the product at all.
- Start Date: This column shows the first time and date the visitor opened this product.
- Last Login: Here you will see the last time and date they visited the product page.
- Login: This is the number of times the visitor opened this product page.
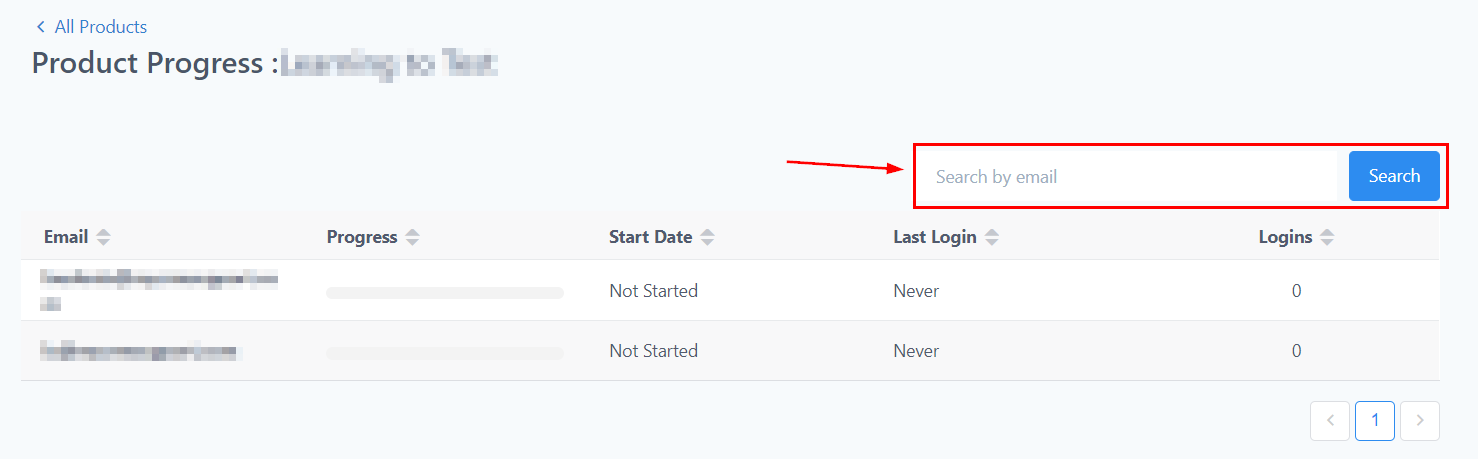
Search Filter
If you have a ton of visitors, you can search for a visitor by filtering through their emails.
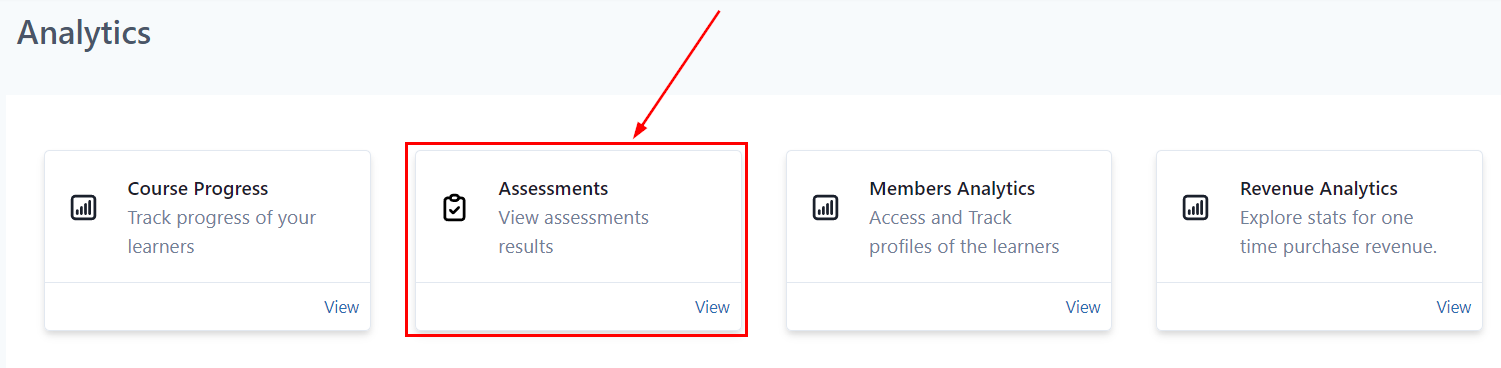
Assessment Analytics
If you want to view your assessment progress, click here to direct to the assessment progress table.
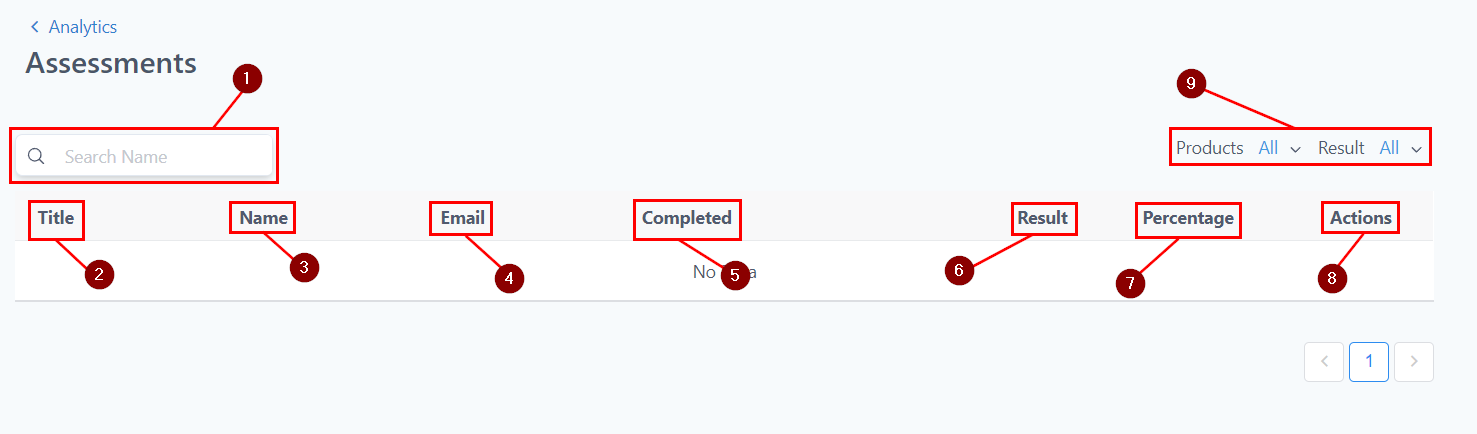
- Search Bar: If you have a ton of visitors, you can just search for a visitor by filtering through the member's name or assessment title.
- Title: Here you see the title of each assessment
- Name: The names of each member who took the assessment are displayed in this column.
- Email: The email address of each member who took the assessment is displayed in this column.
- Completed: This column shows whether the members completed the assessment or not
- Result: The result of each member; whether they Passed or Failed is displayed here
- Percentage: This shows the percentage score of their grades
- Actions: You can also click on the eye icon next to a submission to see what answers they submitted.
- Filter: You can filter the Analytics for Assessments from a specific product by choosing the dropdown next to Products on the top right or You can also filter Assessment analytics by Results.
Members Analytics
Effortlessly monitor the progress of every user enrolled in your courses.
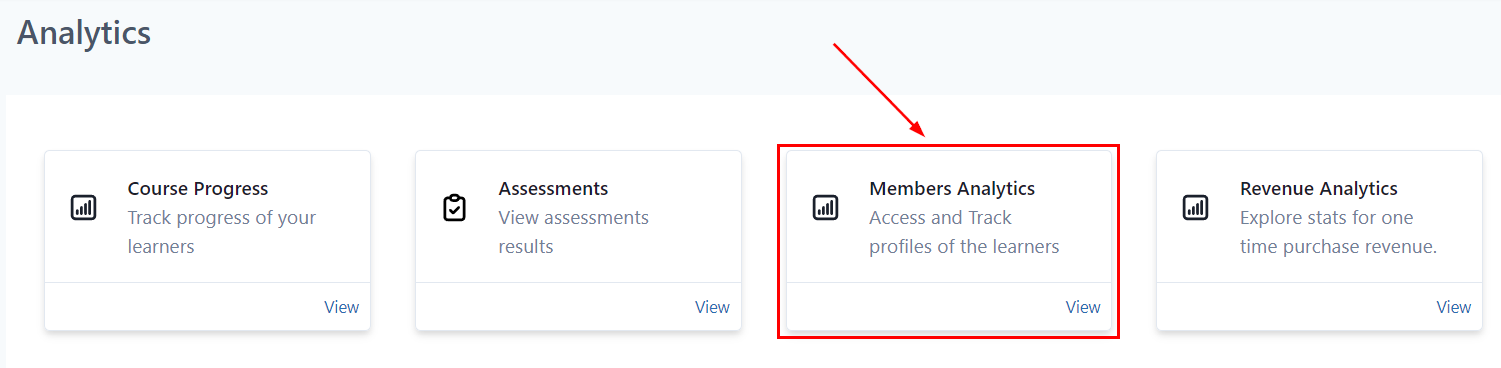
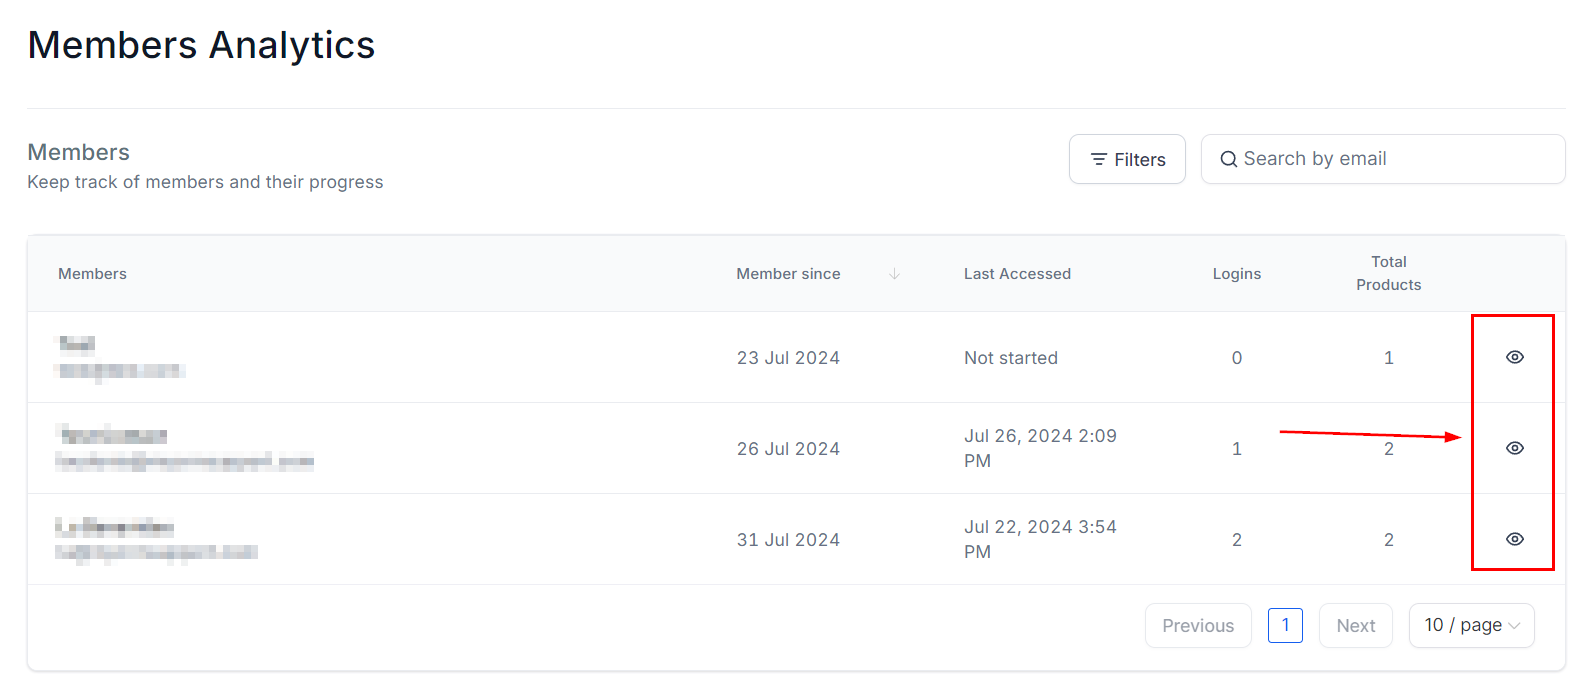
Track Progress
If you want a detailed view of how each member is progressing through the course, you can click this icon.
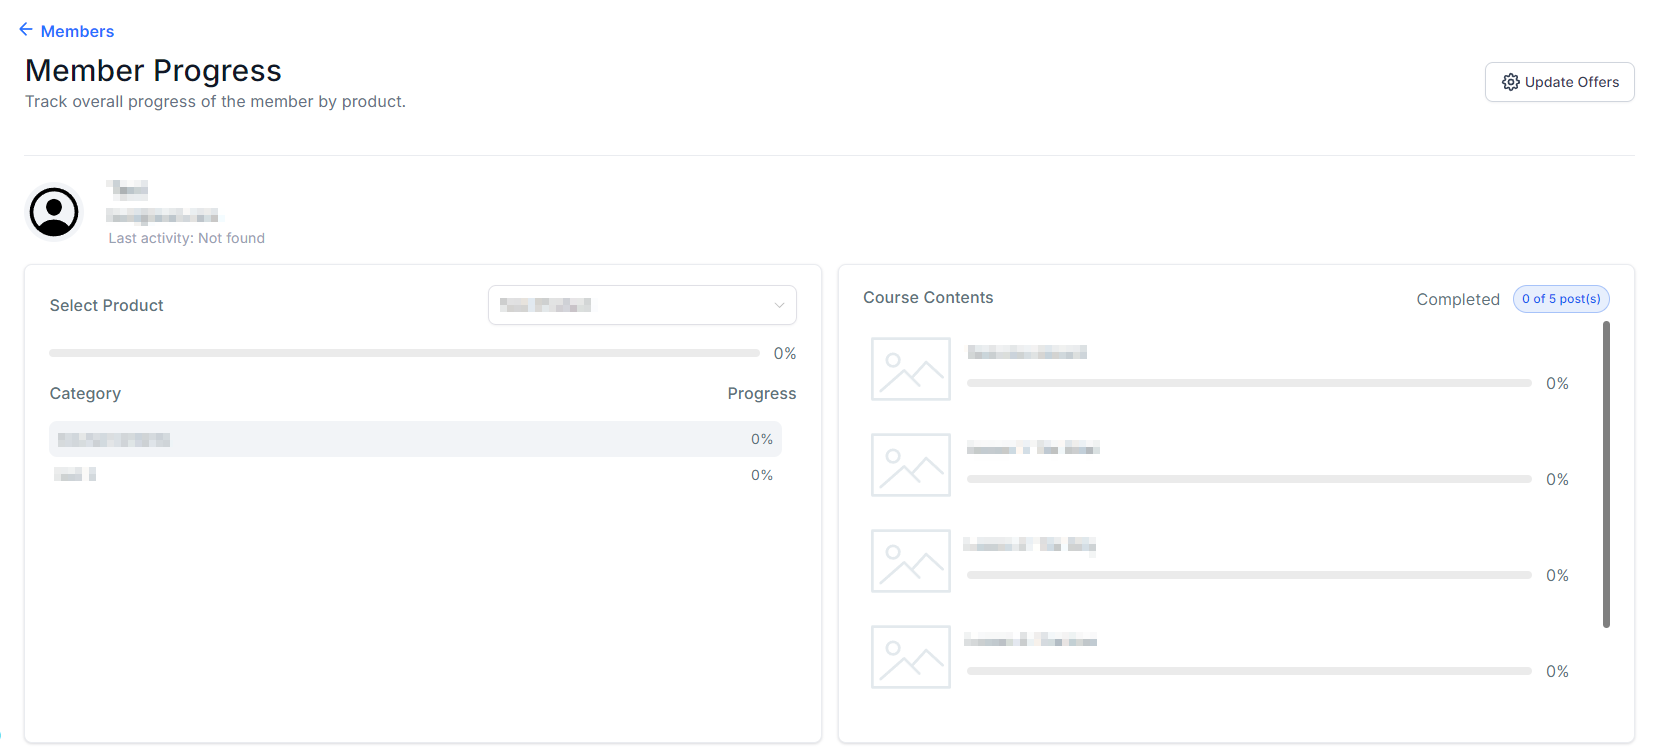
Members Progress
This area shows the lessons the selected members have completed so far.
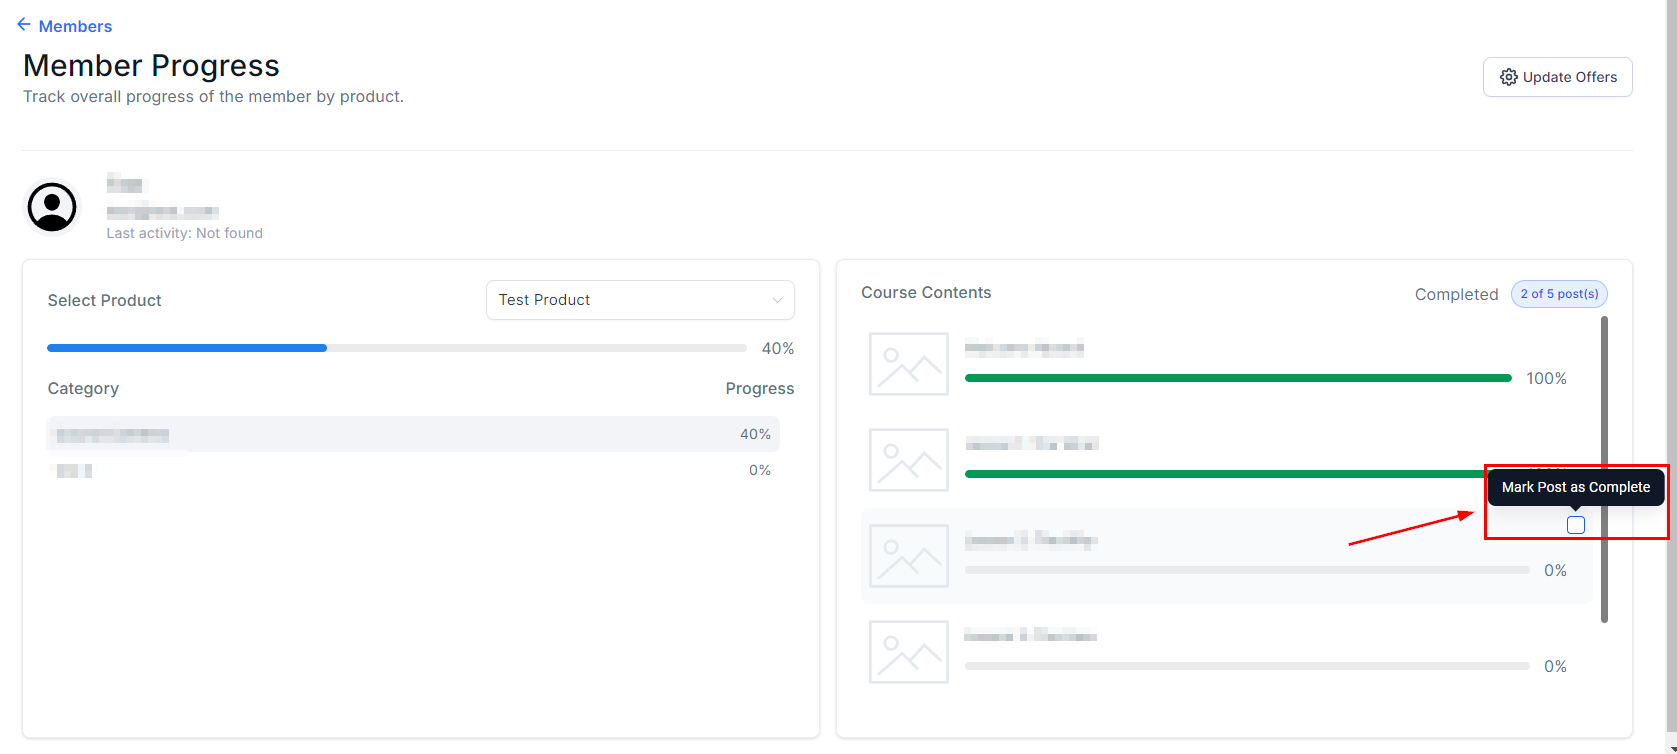
Marking Completion
Using this Checkbox, Instructors can mark a course step as complete.
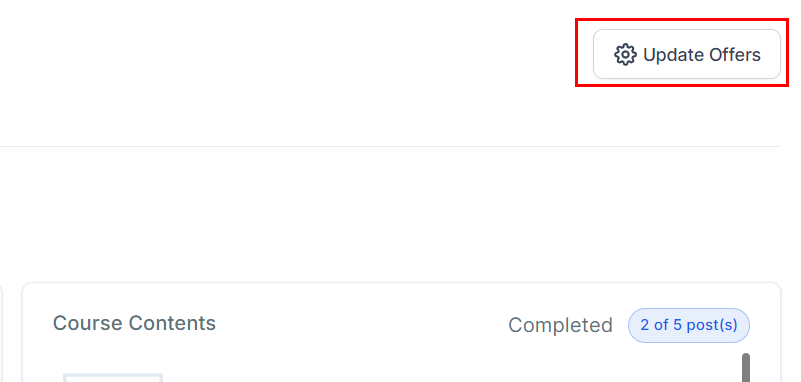
Update Offers
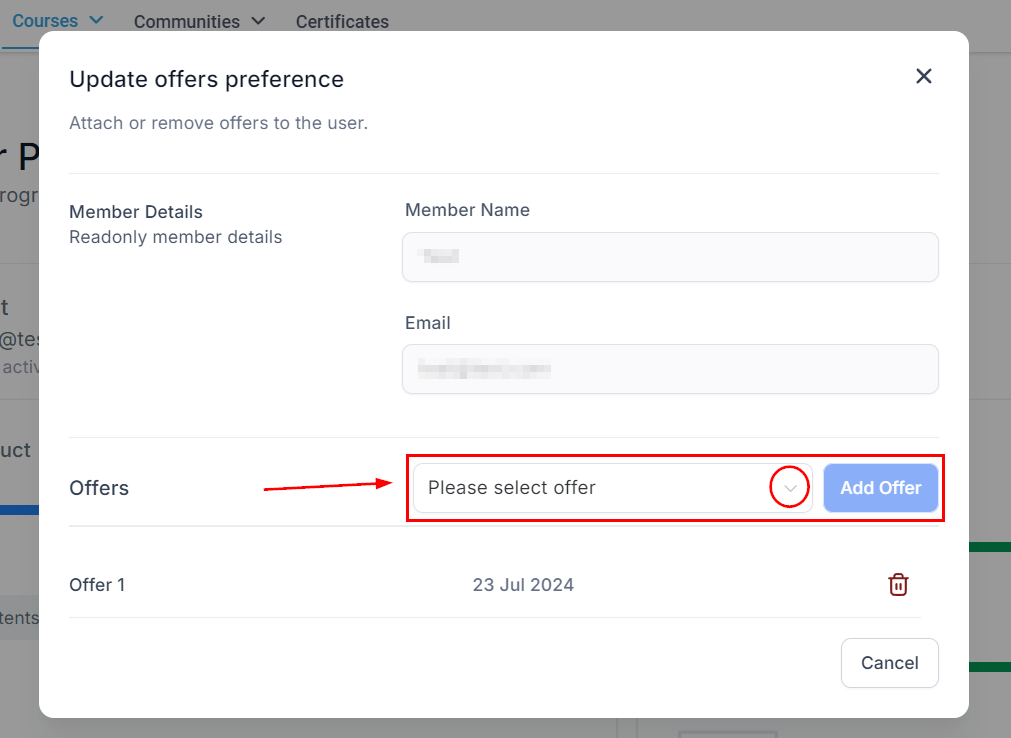
Click this tab to manage the membership offers for the selected member.
This dropdown will show you the existing membership offers for you to choose from.
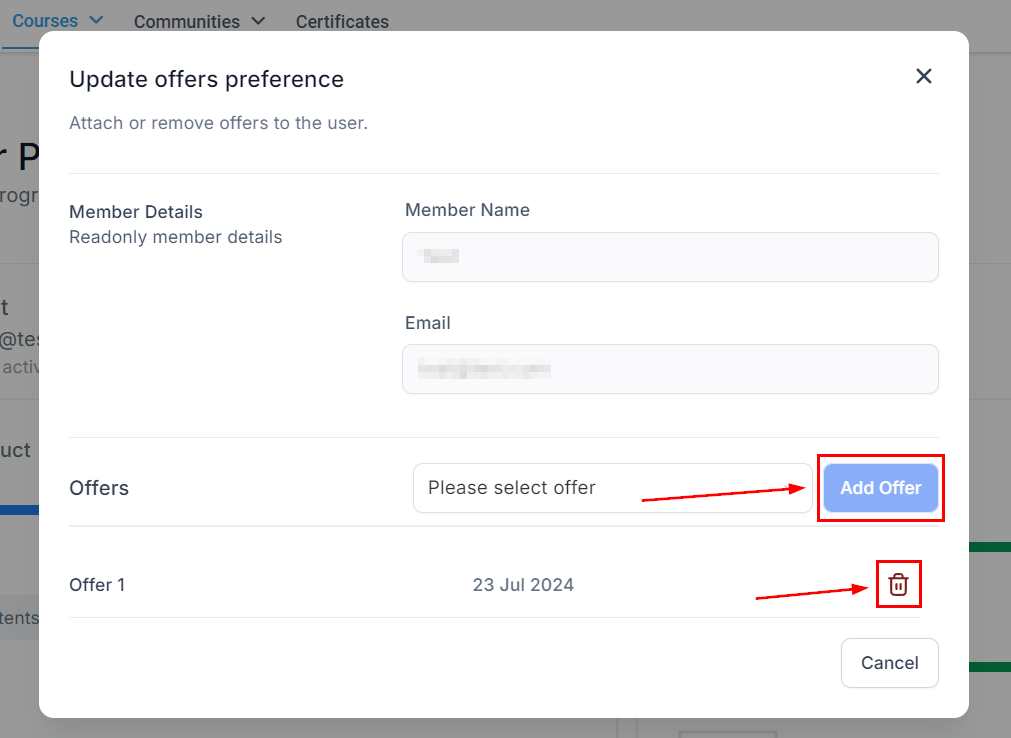
Add /Delete Offer
You can add a new offer or delete one of the existing offers for the selected member. This is useful when you have Multiple levels of course bundle to offer.
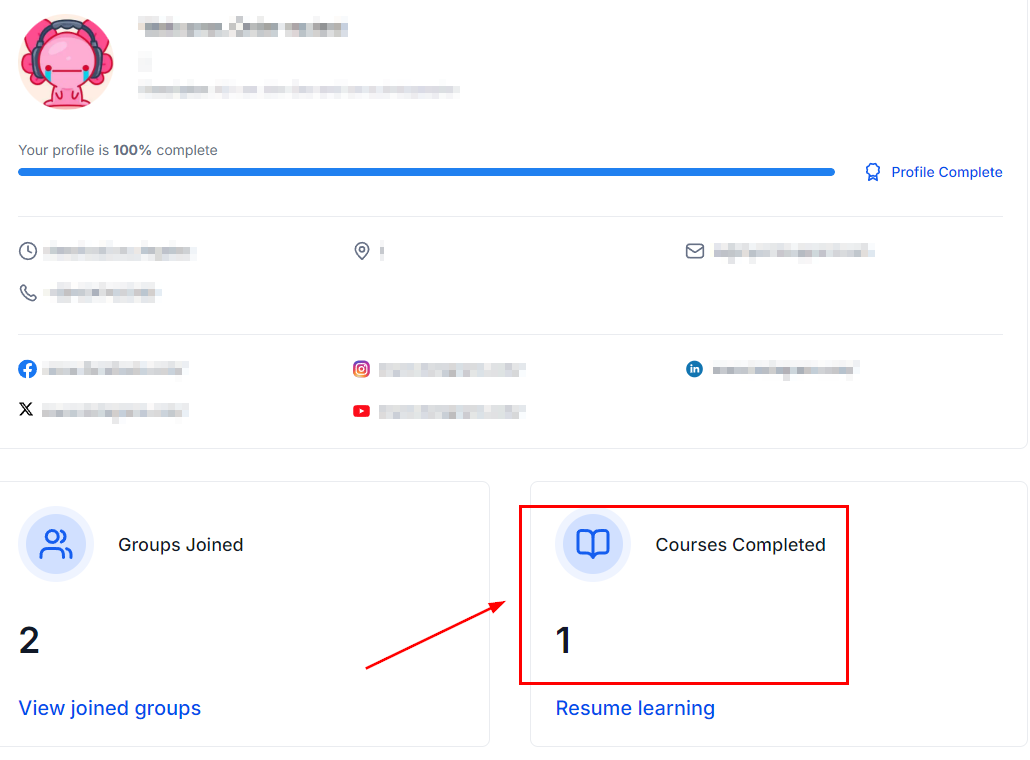
User Progress Tracking
By going to their profile inside the client portal your customers can keep track of their progress and review the total courses they've completed.
Revenue Analytics
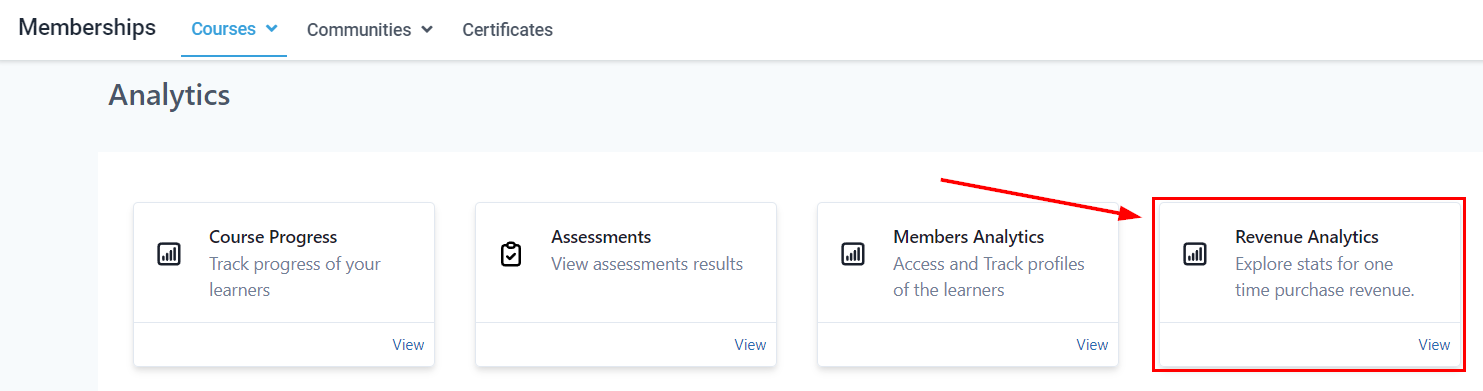
This section gives you graphs and stats for the revenue the one-time purchase of your Membership offers has generated.
Net Revenue
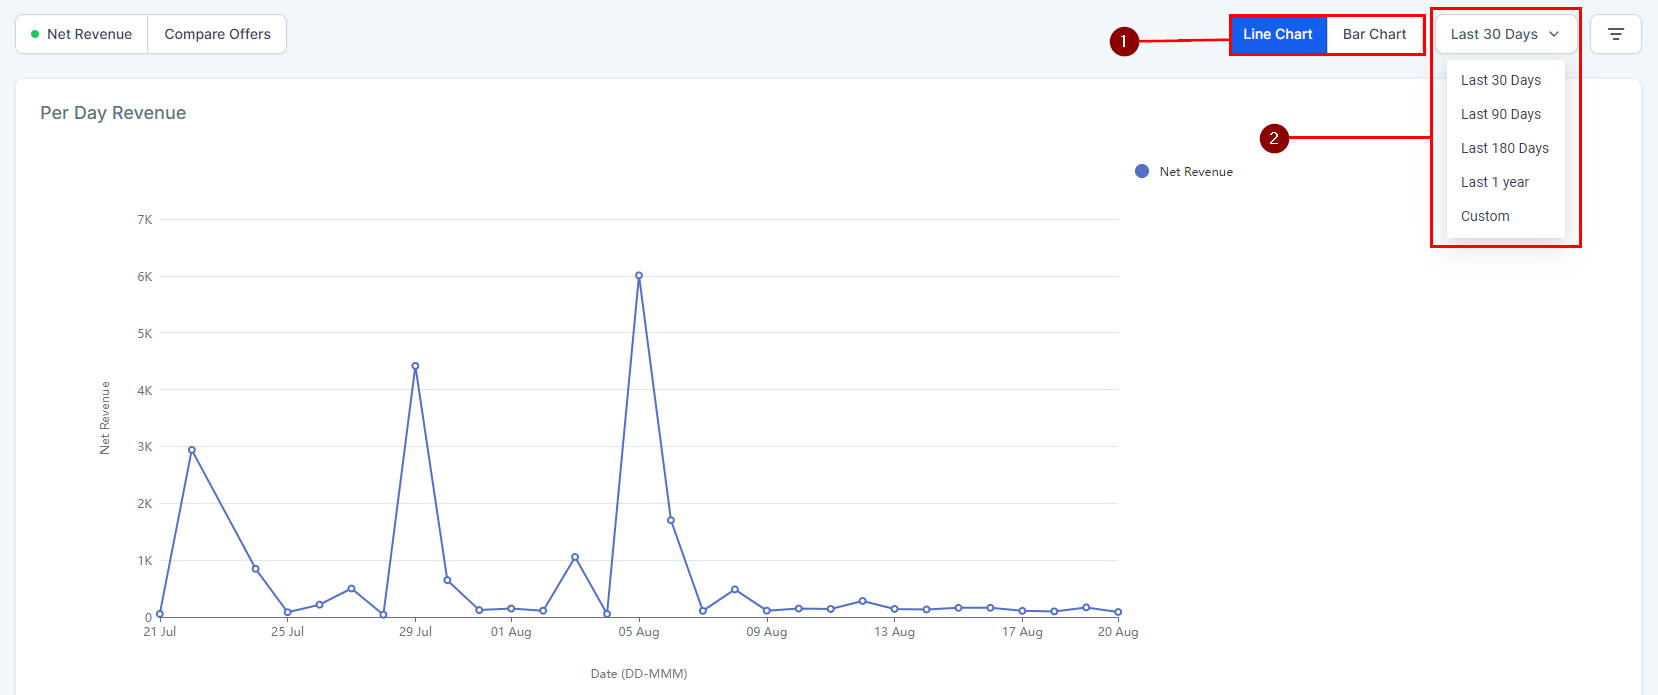
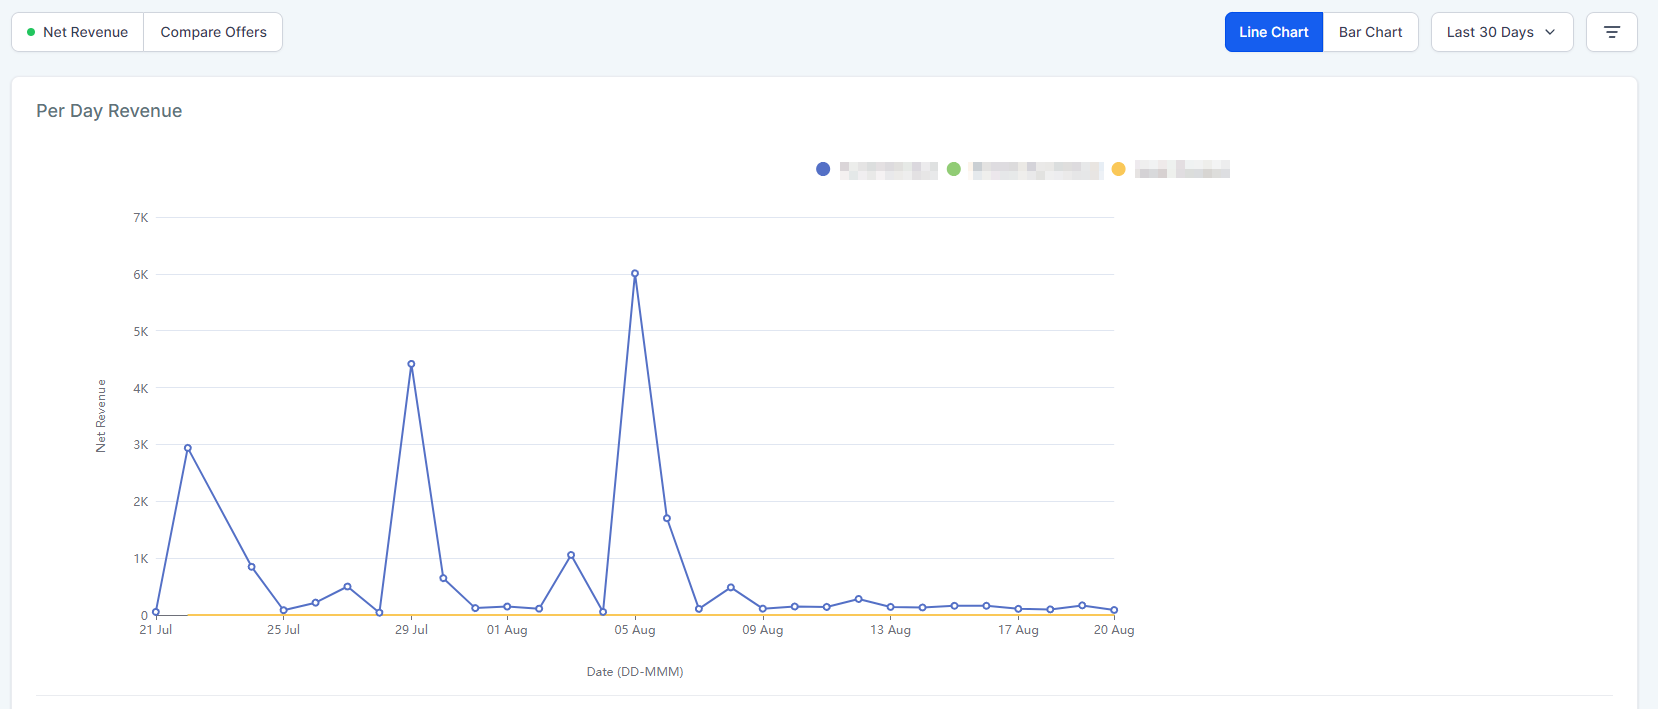
This will deal with data from all offers as a whole, this information is separated into two main graphs. Per Day Revenue which shows your day-to-day total revenue.
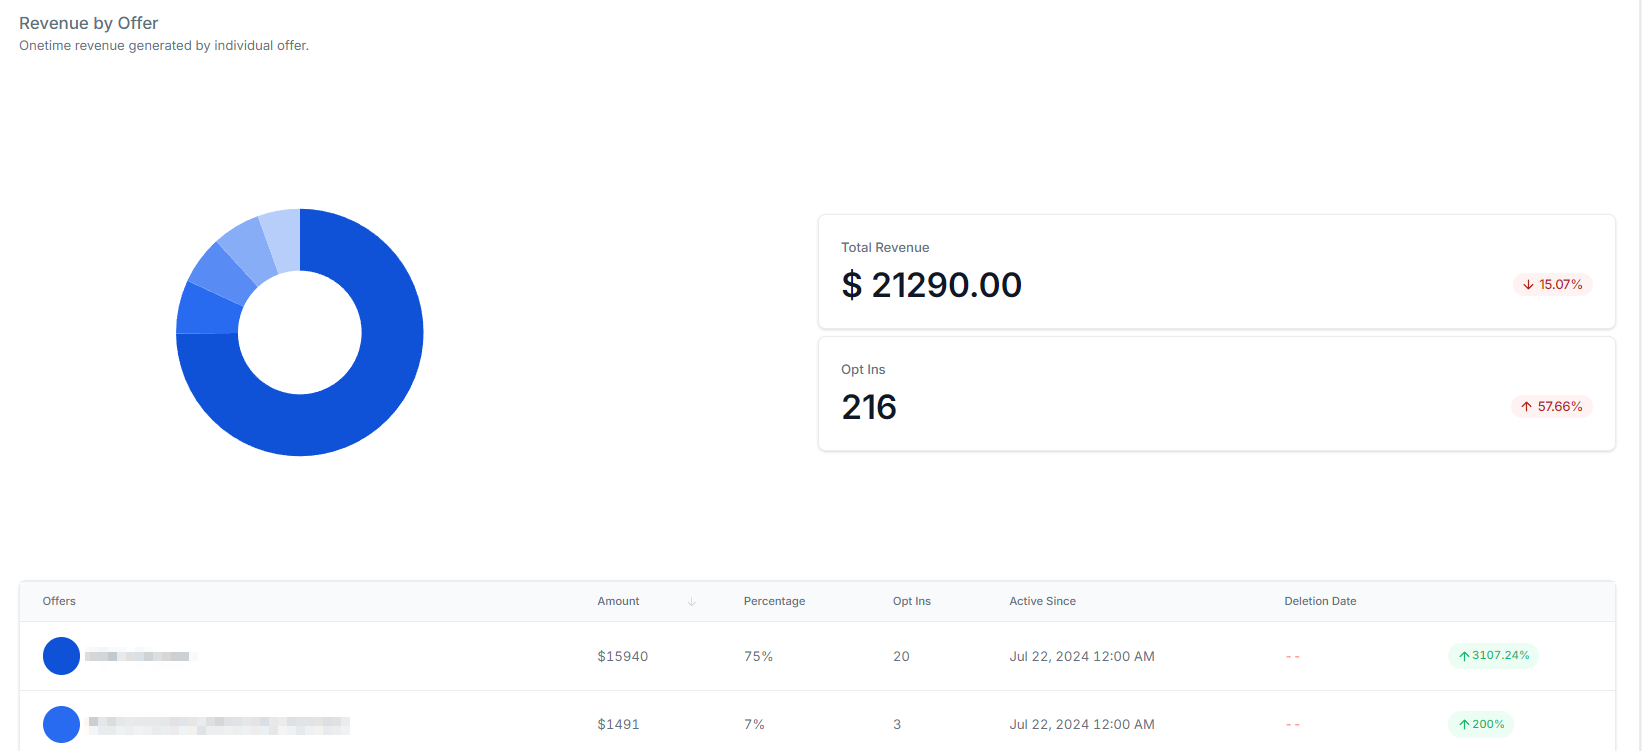
Revenue by Offer which separates the data for its specific offer.
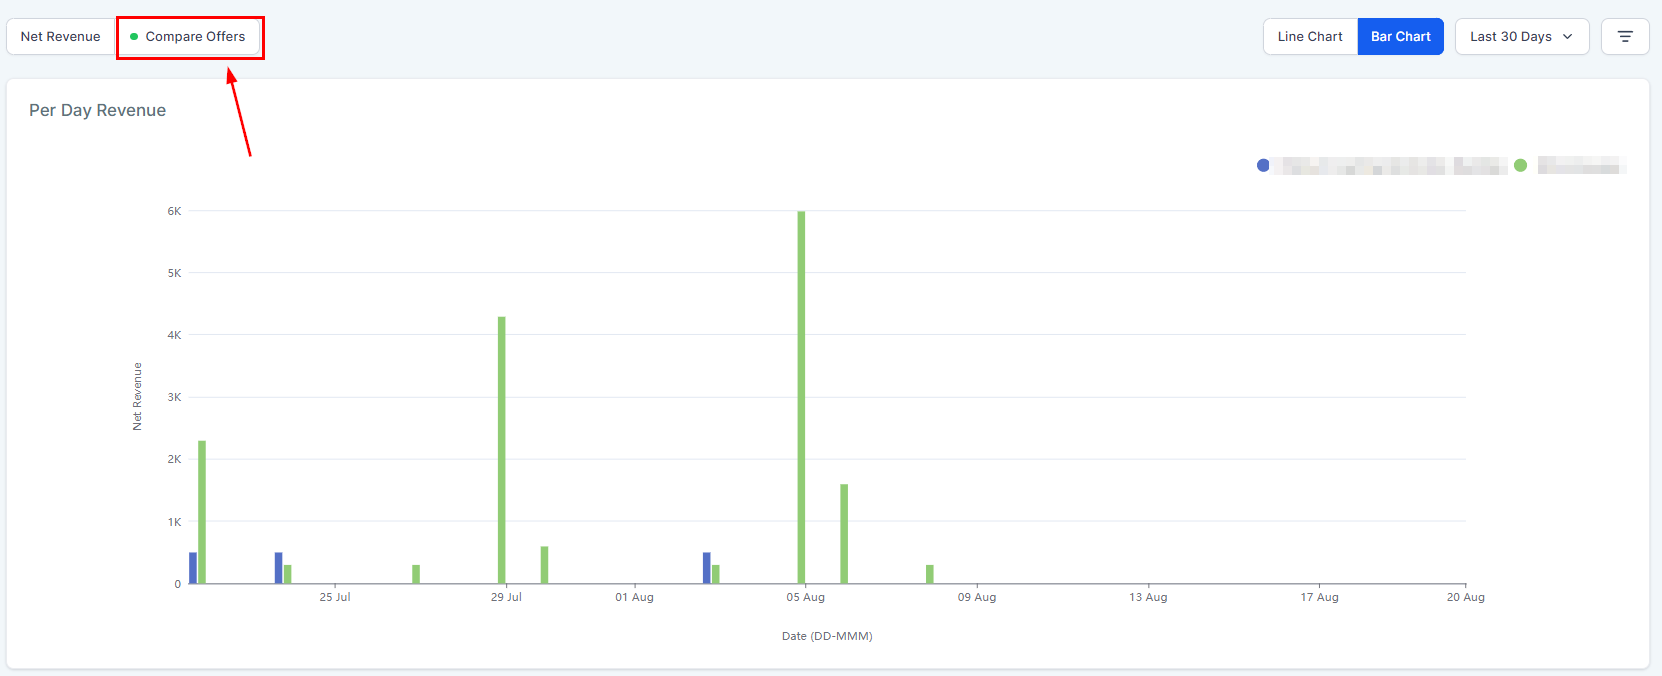
Compare Offers
This allows you to visualize the data from multiple offers in a side-by-side comparison.
Data Options
You can change the way the graphs are displayed (1) and the days covered (2) to better understand and convey the revenue information.